On aggregate, global financial leverage has further increased since the great financial crisis. Most worrisome is the declining debt service capacity of public and private borrowers due to falling potential GDP growth and inflation. This precarious development virtually enforces very low real interest rates. EM leverage has increased fastest in recent years. China in particular poses maybe the greatest global debt problem.
Buttiglione, Luigi, Philip Lane, Lucrezia Reichlin, and Vincent Reinhart (2014), “Deleveraging? What Develeraging?”, Geneva Reports on the World Economy 16, CEPR Press, September 2014.
http://www.voxeu.org/content/deleveraging-what-deleveraging-16th-geneva-report-world-economy
The below are excerpts from the report. Emphasis and cursive text have been added.
The issue
“The length and depth of the crisis, as well as the weak recovery, cannot be understood without an analysis of the role of debt dynamics…Contrary to widely held beliefs, the world has not yet begun to de-lever and the global debt-to-GDP is still growing, breaking new highs. At the same time, in a poisonous combination, world growth and inflation are also lower than previously expected, also – though not only – as a legacy of the past crisis. Deleveraging and slower nominal growth are in many cases interacting in a vicious loop, with the latter making the deleveraging process harder and the former exacerbating the economic slowdown. Moreover, the global capacity to take on debt has been reduced through the combination of slower expansion in real output and lower inflation.”
The global debt dynamics
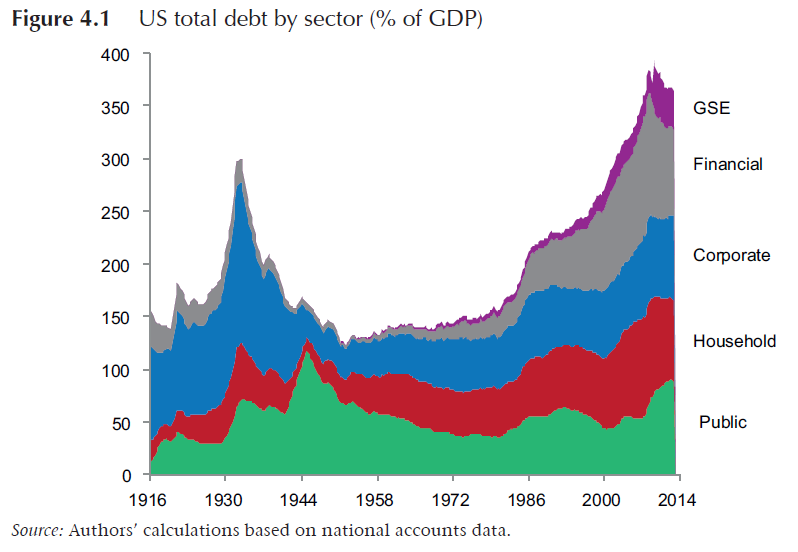
“The ratio of global total debt excluding financials over GDP (we do not have, at this stage, a reliable estimation of financial-sector debt in emerging economies) has kept increasing at an unabated pace and breaking new highs: up 38%-points since 2008 to 212%….the increase of the global debt-to-GDP ratio was led by developed markets until 2008 (up 39%-points from 2001) and by a sharp acceleration in emerging markets in the post-crisis years (an increase of 36%-points, compared with 25%-points in developed markets).”
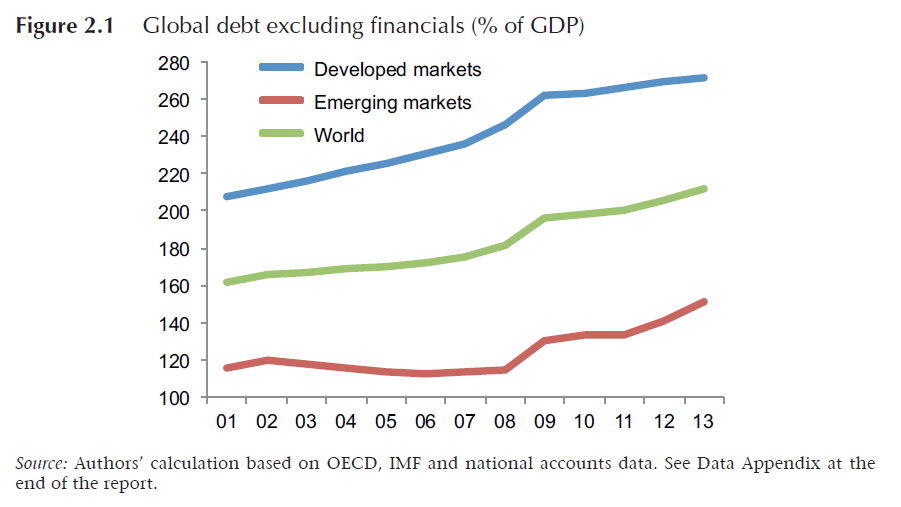
“In developed markets, for which we also have reliable information on the financial sector, total debt as a percentage of GDP has stabilised since 2010 at a level very close to its all-time high (385%) as a result of a drop in financial-sector leverage, while debt ex-financials has kept rising.”
“The level of overall leverage in Japan [562% of GDP] is off the charts; while its status as a net external creditor is an important source of stability, the sustainability of large sectoral debt levels remains open to question.”
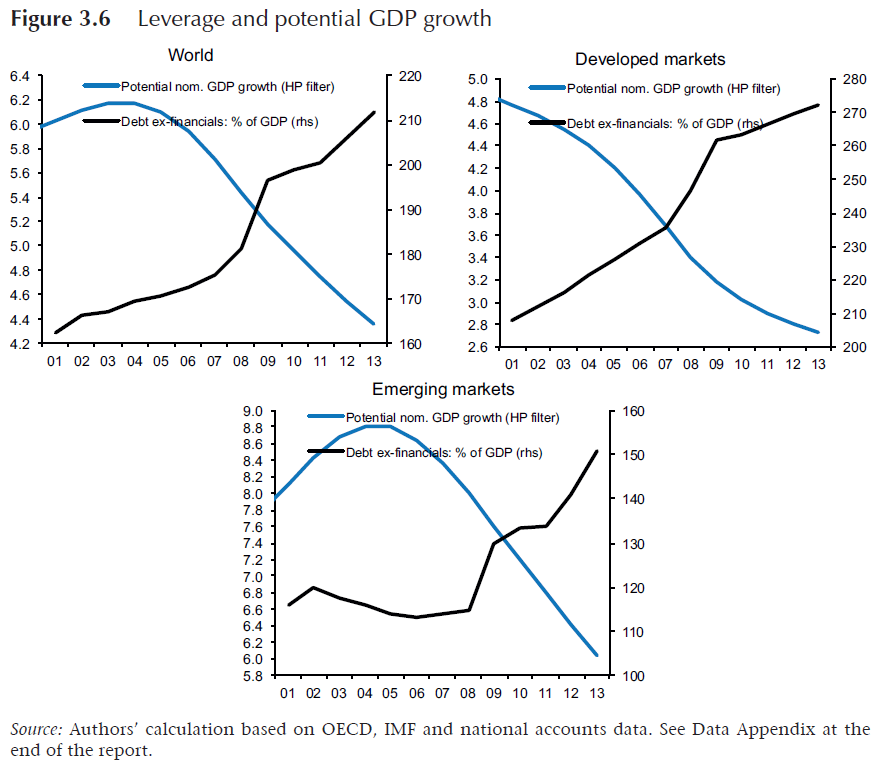
A trap of higher debt and lower nominal growth
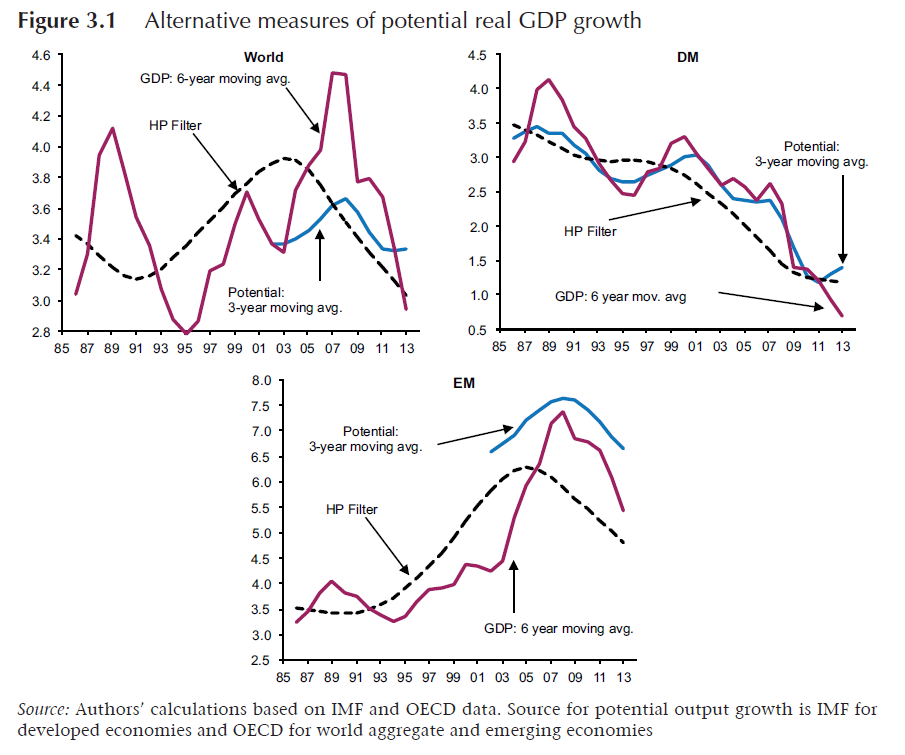
“Given the definition of leverage…– the debt-to-GDP ratio – leverage dynamics are intimately related to those of nominal GDP, which in turn is determined by those of both real growth and inflation.”
“Potential output growth in developed economies has been on a declining path since the 1980s and…the crisis has caused a further, permanent decline in both the level and growth rate of output…growth has been slowing since 2008 also in emerging markets, most prominently China… In addition, inflation rates have also failed to rebound after the cyclical downturn during the crisis, such that the path for nominal output growth is substantially lower relative to that expected before the crisis period. If the unexpected decline in inflation persists, an implication is that real interest rates may turn out to be higher than their equilibrium level…In this context, the equilibrium real interest rate – that is, the interest rate compatible with full employment – is also poised to stay at historical low levels and debt capacity will be under pressure if the actual real rate settles above its equilibrium level. This is likely to be the case in jurisdictions subject to the combined pressure of declining inflation and the zero lower bound constraint.”
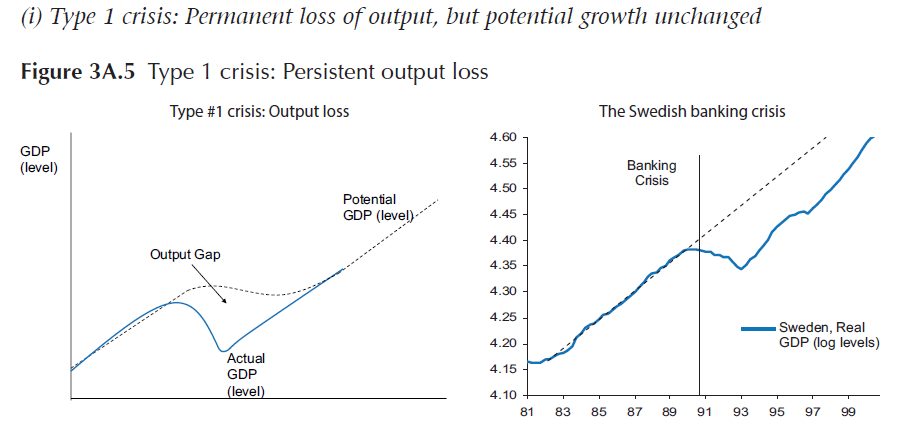
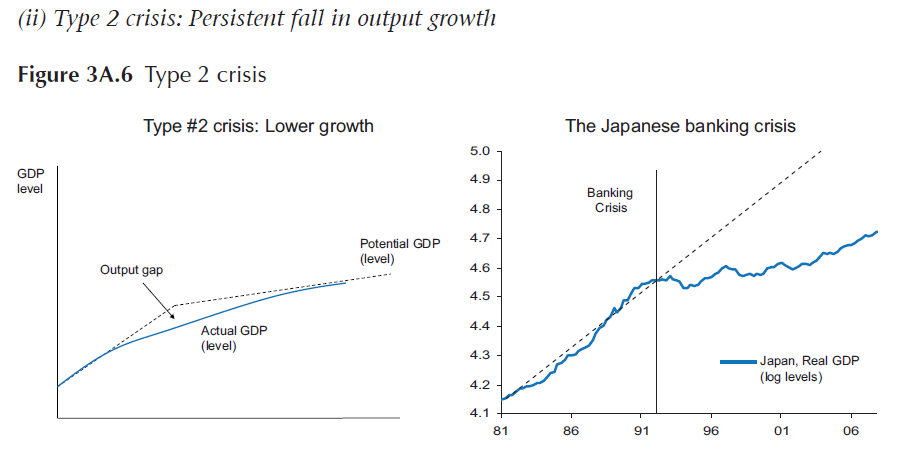
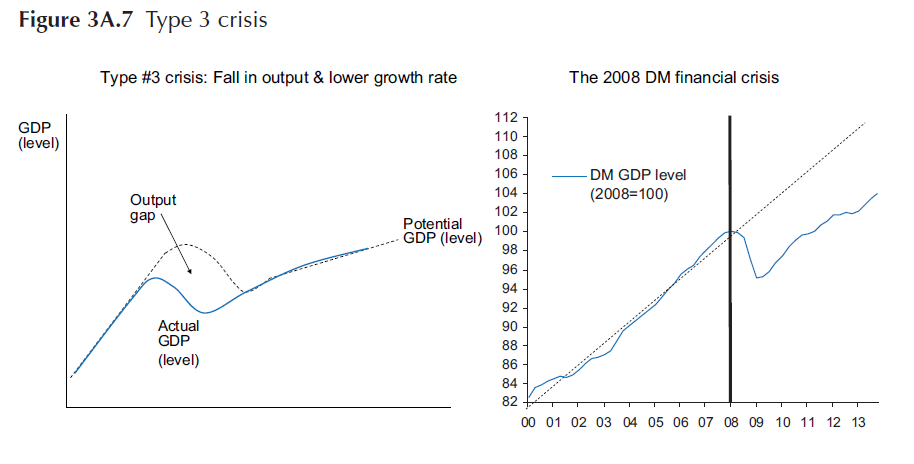
“The need to readjust to a lower debt capacity is associated with some economic dislocations… In a crisis, the loss of output or the slowdown in output growth is not temporary, but persistent. Indeed, with this background, we can classify three different paths… A Type 1 financial crisis is one in which, unlike a recession, the level of output shows a persistent loss, but potential output growth remains unchanged… A Type 2 financial crisis is one in which the level of output does not contract in any meaningful way, perhaps because bankruptcies or defaults are not allowed and public debt inflates. However, due to the extent of the problems or to wrong policies (lack of bank recapitalisation, monetary policy not sufficiently expansionary, etc.), a steep pace of deleveraging in some sectors of the economy (bank lending, external financing, etc.) spreads over a long period of time… the worst type of financial crisis is one in which both the level and the growth rate of potential output are affected sizeably and negatively, due to both the roots of the crisis and the policy response… The post-2008 crisis that occurred in developed markets has turned out to be a Type 3 crisis since it has been characterised by a persistent loss of output and, arguably, a slowdown in the trend global growth rate.”
The Anglo-Saxon strategy
“Anglo-Saxon economies – namely, the US and the UK – seem to have managed the trade-off between deleveraging policies and output costs better so far, by avoiding a credit crunch while achieving a meaningful reduction of debt exposure of the private sector and the financial system. This result, however, was achieved at the cost of a substantial re-leveraging of the public sector, including the central banks, whose deleveraging is a primary policy challenge for the years to come.”
“The US and the UK account for the bulk of the gradual deleveraging process in the financial sector. In the US, the ratio of debt to GDP in the financial sector has in fact fallen to its lowest level since the beginning of the new millennium…the ratio of public debt to GDP increased by 46 %-points in the UK and by 40 points in the US, which are sharper increases than in the Eurozone (+26 %-points), since policies in the former countries have (in different ways) permitted a greater expansion of the government balance sheet than in the latter region, so as to allow a gradual deleveraging in the private sector.”
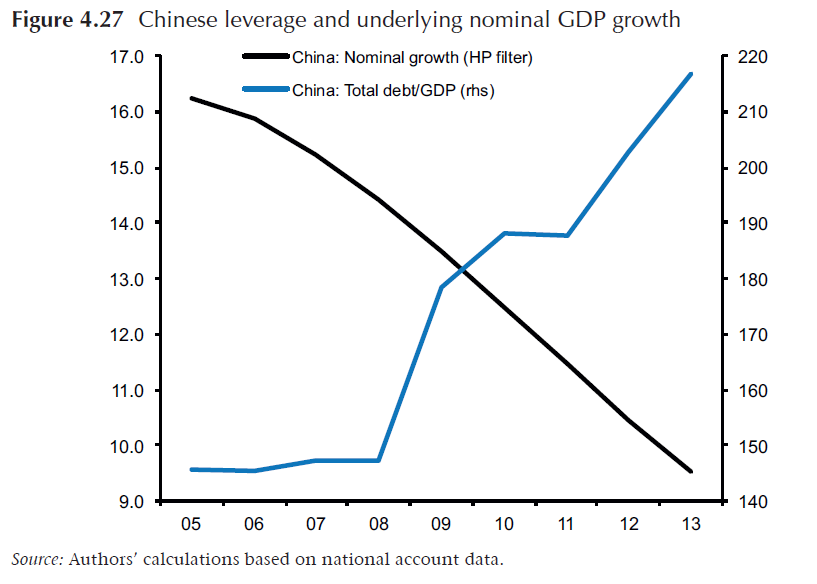
The EM/China problem
“Global debt accumulation was led until 2008 by developed economies. Since then, it has continued [through]… a sharp rise in the debt levels of emerging economies. This group of countries are a main source of concern in terms of future debt trajectories, especially China and the so-called ‘fragile eight’, which could host the next leg of the global leverage crisis.”
“Since 2008, Chinese total debt (ex-financials) has increased by a stunning 72% of GDP or 14% per year, a shift almost double that experienced by the US and UK in the six years that preceded the beginning of their financial crisis in 2008. This brisk acceleration has brought the overall leverage of the Chinese economy to almost 220% of GDP, almost double the average of other emerging markets… China is facing a poisonous combination of high, fast-growing leverage and slowing nominal GDP. This, in turn, suggests growing difficulties in servicing and repaying debt in a number of sectors in the future are likely. These difficulties might be exacerbated by the fact that market rates are likely to increase as a consequence of ongoing financial reforms.”