Trend following is a systematic investment style that takes directional positions in accordance with the difference between the current price and a moving average. For longer moving averages most trend following strategies would have outperformed simple buy-and-hold and value-based strategies in U.S. equities for many decades. Moreover, the simplest rules have been the best: there has been no benefit in high-frequency trading, stop losses, and conventional complications.
Clare, Seaton, Smith and Thomas, “Breaking Into The Blackbox: Trend Following, Stop Losses And The Frequency Of Trading, The Case Of The S&P500”, Journal Of Asset Management, Vol. 14: 182-194
A publically available paper can be found on
http://papers.ssrn.com/sol3/papers.cfm?abstract_id=2126476
The below are excerpts from the paper. Emphasis and cursive text has been added.
What is trend following?
“Trend following is a popular investment technique…among systematic investors…based on moving averages where the current market price of an asset is compared with an average of historical prices of the same asset over some window, often 200 or so trading days: if the current price is above (below) the moving average…the rule gives a buy (sell) signal.”
“The underlying economic justification for trend following rules lies in behavioural finance tenets such as those relating to herding, disposition, confirmation effects, and representativeness biases. At times information travels slowly, especially if assets are illiquid and/or if there is high information uncertainty; this leads to investor under-reaction. If investors are reluctant to realise small losses then momentum is enhanced via the disposition effect.”
[Confirmation effects denote that an investor would be more likely to look for information that supports his or her original idea about an investment rather than seek out information that contradicts it, impairing information efficiency. The disposition effect suggests that investors are more willing to recognize (and monetize) gains than losses, which implies that they are ‘fighting’ market trends going against them. The representativeness bias means that, under uncertainty, investors are prone to believe that a history of a remarkable performance of an asset is ‘representative’ of a general performance that the asset will continue to generate into the future.]
“We consider 3 types of trend following rules…
- Simple daily moving averages, where the buy signal occurs when the S&P 500’s index value moves above the average; we consider moving averages ranging from 10 to 450 days… The intuition behind the simple trend following approach is that while current market price is most certainly the most relevant data point it is less certain whether the most appropriate comparison is the price a week ago or a month or a year ago.
- Moving average crossovers where the buy signal occurs when the shorter duration average of the S&P 500’s index value moves above the longer duration average, and which ranged from 25/50 days through 150/350 days;
- Breakout rules, which indicate a buy signal when the S&P 500’s index value trades at a ‘x-day’ high, where ‘x’ ranges from 10 to 450 days… breakout signals emphasise even more the distinction between a recent/current price move and recent past.”
How has S&P trend following performed historically?
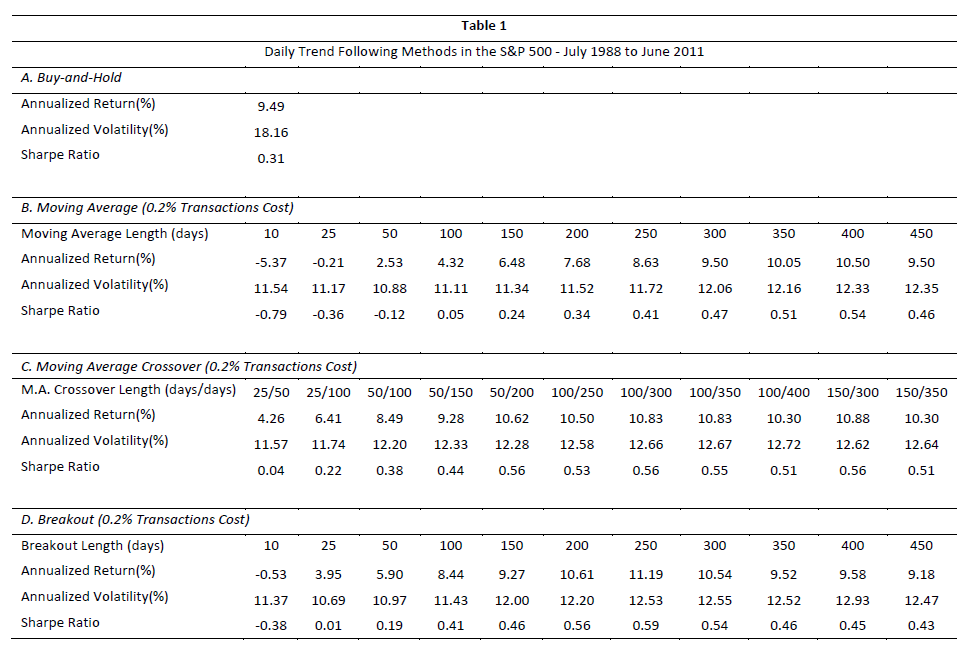
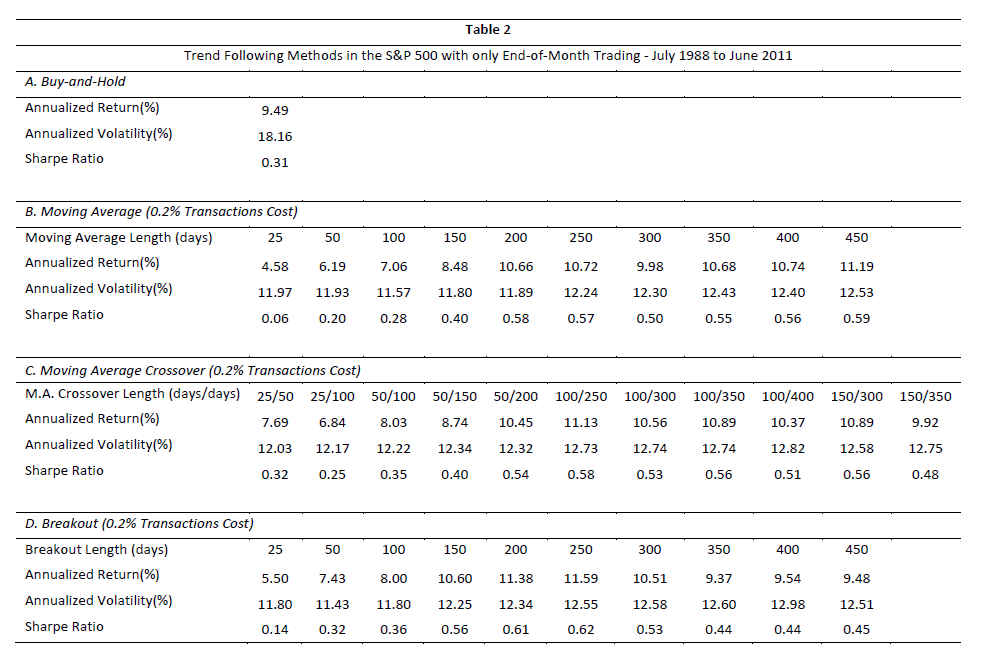
“We utilise daily S&P 500 price and total return data from July 1988 to June 2011 and daily price and monthly return data from January 1952 to June 2011 in this study… Table 1 presents our results for the 3 classes of moving average rules based on daily signals and trading [for long S&P or cash positioning], while Table 2 uses end-of-month rules and trading.”
[Trend-following rules have not generally outperformed the simple buy-and-hold strategy. However, those trend-following rules that are based on longer moving averages, over 200 days, all posted higher Sharpe ratios]
What has performed better, simple or complex rules?
“To this end we compare a variety of moving average, crossover, channel and breakout rules… there is no advantage in complicated trend following rules versus simple rules [as shown in the tables above]… ‘whipsawing’ [frequent shifting between long and cash positions, incurring excessive trading costs] is not a problem provided the technical signals are of reasonable length(not too short).”
Has there any advantage in trading frequently, e.g. daily versus monthly?
“In each case – moving average, moving average crossover and breakout – the best Sharpe ratios are generally higher for end-of-month investing rules than for those achieved by applying the rules on a daily basis. For example, the Sharpe ratio for the moving average rule using daily decision rules ranges from -0.79 to 0.54; the equivalent range for monthly decision making, is 0.06 to 0.59. Generally speaking, the monthly application of the rules produced higher average returns with lower return volatility.”
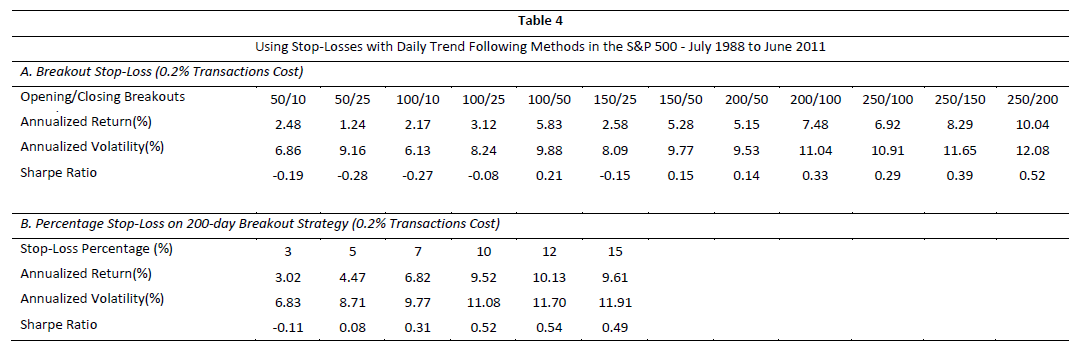
Has it been useful to apply stop-loss rules?
“These rules, which seek to liquidate positions once a certain drawdown or calendar time loss has been experienced, are widely used in the fund management industry…We explore the empirical validity of various stop loss rules for the S&P500 index based on daily returns from July 1988 to June 2011. Table 4 shows two types of strategy…a conventional break out and re-entry stop loss rule… [and] trailing stop losses… In both cases stop-loss rules would seem to make performance worse.”
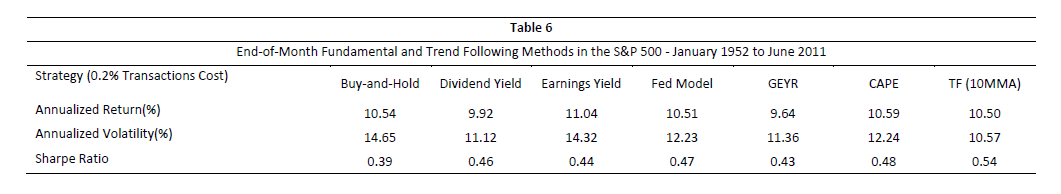
How have trend following rules performed versus fundamental metrics?
“The wide range of practical valuation metrics include dividend and earnings yields, together with the relative yields on bonds and equities…Table 6 shows the results using the long period of data from January 1952 to June 2011. The table clearly shows the superiority of the end of-month 10 month rule in terms of Sharpe ratio both relative to long only S&P and the various valuation metrics [albeit that superiority would not apply to all specifications of trend following strategies presented in the paper].”