Paul de Grauwe and Yuemei Ji have produced disarmingly simple charts that show why the euro area’s 2010-12 crisis response is being discredited. Essentially they illustrate that (i) market conditions rather than fundamentals have driven large absolute changes of credit spreads, (ii) fiscal tightening has been a mechanical response to credit spreads, and (iii) austerity has largely been self-defeating. Such evidence of failed excessive austerity dovetails anti-euro populism, underpinning euro area policy change towards more accommodation.
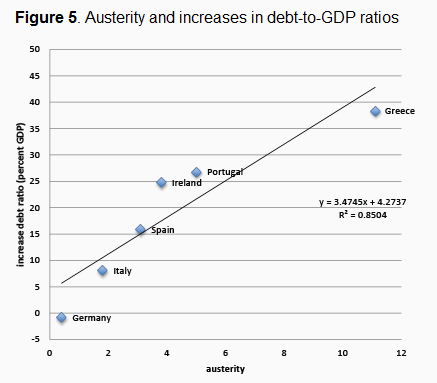
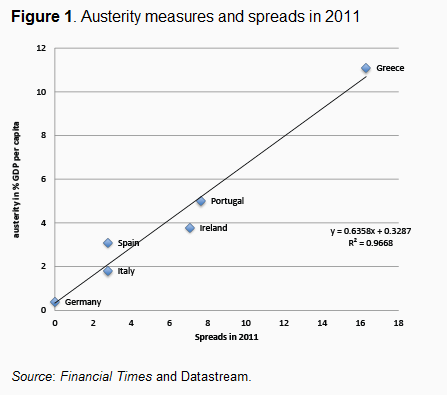
The first chart below shows the average interest rate spreads in 2011 on the horizontal axis and the intensity of 2011 austerity on the vertical (as measured by the Financial Times) on the vertical axis. It makes the case that the degree of fiscal tightening has almost uniquely been explained by credit spreads, no other economic and social consideration.
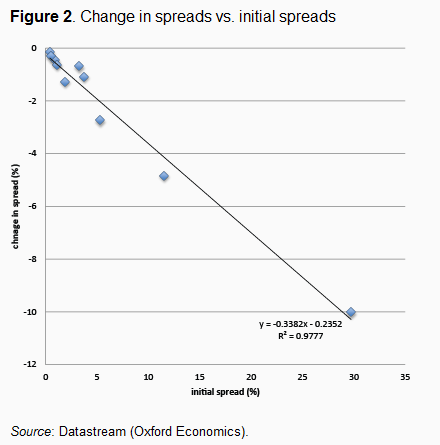
The second chart below illustrates that the change in spreads in % that ensues from a change in market sentiment is often a linear function the initial spread level, not of fundamentals. For professional investors this sounds trivial, but for governments it means that the weakest country experiences the most profound change when markets move. The authors use the impact of the ECB’s open monetary transactions to show this. The vertical axis measures the spreads in the euro area from mid- 2012 to early-2013. The horizontal axis presents the initial spread. Interestingly, the initial spread explains almost all the subsequent variation in the spreads. The authors also illustrated elsewhere that that changes in popular “fundamentals” may have no impact at all on sea changes of credit spreads.
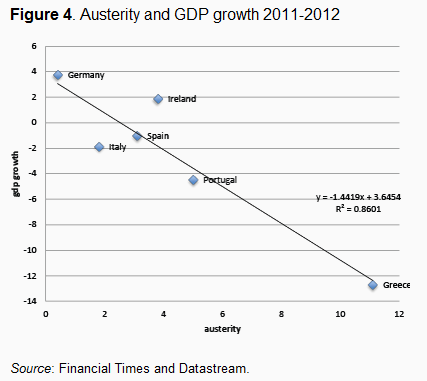
The third chart illustrates the impact of austerity on growth. It shows the relation between 2011 austerity and 2011-12 GDP growth. There is a plain and clear linear relation: countries that imposed the strongest austerity experienced the strongest recessions.
The fourth chart below then indicates that austerity seems to have been of little help in improving debt dynamics (in the short run anyway), but rather the opposite. The chart shows the austerity measures and the subsequent change in the debt-to-GDP ratios, finding a strong positive correlation. The more intense the austerity, the larger is the subsequent increase in the debt-to-GDP ratios.